Probabilites of solved portions on a random Rubik's Cube
December 21, 2006
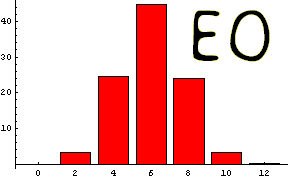
Ever wondered why you occasionally get a blindfolded solve with most edges or corners oriented, but (almost) never all of them? Ever noticed that on any scramble there is often at least one piece in position? (60% chance) Ever wondered what the Jacobsthal sequence, Pascal's triangle, derangements, e, and perhaps even pi have to do with a Rubik's cube? Ever wondered about the actual probabilities that a certain number of edges/corners are correctly oriented/positioned? Well, here they are:Addition (December 31, 2006): I ran a few Mathematica simulations (using some elementary code); they matched the predicted values quite accurately. Each red bar chart depicts at least 10000 cubes (scrambled 100 random twists).
Edges, alone, can be considered as a set of twelve objects that are randomly permuted. The parity is irrelevant, since we are considering edges alone. The same apllies for corners. Thus, we can use the solution to a well-studied problem. It turns out, in fact, that the probability of n corners/edges from the entire set of m of them being in place depends not so much on m, but on n. The chance of no pieces being in place is the closest possible approximation to 1/e. The probability of 1 piece in place is virtually identical (1/m! less, which is tiny), so about 1/1 as much. The chance of 2 in place is 1/2 as much as that, the chance of 3 being in place is about 1/3 of that, the chance of 4 is 1/4 of that...While this s all technically approximation, it matches fact as closely as possible. This is where the 1/e comes from; it scales the sum of probabilities to 100% Of course, the chance of all pieces placed correctly is 1/m! The chance of all but 1 being in place is 0%, since the last piece is not allowed to fit into the remaining place. So:
The chance of n corners being placed correctly on a randomly scrambled cube:

The chance of n edges being placed correctly on a randomly scrambled cube:

One exception: if n = the number of edges/corners, the chance is exactly (1/n!); the rounding is done up.
The chance of n cubies/objects being placed correctly from any randomly permuted set:


Simulations:

Edges orientation is relatively straightforward. The only tricky thing is that the number of flipped edges must be even. There is also the little detail about defining "oriented," but if each edge has a standard facelet, then flippedness checking reduces to checking whether the standard facelet of the edge and its place match.
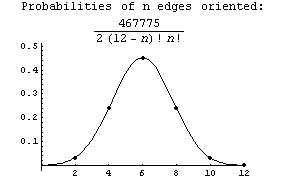
So, we can simply take a binomial, the number of ways of picking n edges, out of the total number of possible orientations (211, since that last one is decided). Thus:
The chance of n edges being oriented correctly on a randomly scrambled cube:
 =
= 
Note that these are equivalent (by Pascal's triangle) to another interpretation:
 =
= 

Simulation: 
This is where it gets crazy. I'll dive right in. Let's consider the case of n oriented corners. We can compute the probability for n particular corners, and the mulitply by the binomial that gives us how many choices of such n corners there are. Of the first n corners, each has a 1/3 chance of being oriented. Each of the next 8-n-1 has a 2/3 chance of not being oriented (if any were, they'd be encroaching on another enumeration taken care of by the binomial). The last corner is special. In fact, due to complicated overlapping-tertiary-Pascal's triangle reasons, the chance that the last corner is unoriented tends toward 2/3 as the number of other oriented edges grows, at exactly the same rate as the terms of the Jacobsthal sequence over consecutive powers of two. It is not, as can confusingly be concluded through barely faulty reasoning, 1/2. Anyhow, the whole chaotic-looking mess (put into closed form through the Jacobsthal sequence's Binet representation) reduces into something accebtable that somehow manages to give correct values (whose total is also 100%).
The chance of n corners being oriented correctly on a randomly scrambled cube:


Graph interpolated in one of several ways; for example,  also works for any (preferably positive) integer x; x=1 yields the graph above through an alternate expression.
Simulation: 
Table of Probabilities
listed by type of solvedness and number of cubies
All 0's are actually 0, due to physical impossibility.
| Number | EP | EP(%) | CP | CP(%) | EO | EO(%) | CO | CO(%) |
| 0 | 16019531/43545600 | 36.8% | 2119/5760 | 36.8% | 1/2048 | 0.0488% | 86/2187 | 3.93% |
| 1 | 1468457/3991680 | 36.8% | 103/280 | 36.8% | 0 | 0% | 112/729 | 15.4% |
| 2 | 16481/89600 | 18.4% | 53/288 | 18.4% | 33/1024 | 3.22% | 616/2187 | 28.2% |
| 3 | 16687/272160 | 6.13% | 11/180 | 6.11% | 0 | 0% | 560/2187 | 25.6% |
| 4 | 2119/138240 | 1.53% | 1/64 | 1.56% | 495/2048 | 24.2% | 140/729 | 19.2% |
| 5 | 103/33600 | 0.307% | 1/360 | 0.278% | 0 | 0% | 112/2187 | 5.12% |
| 6 | 53/103680 | 0.0511% | 1/1440 | 0.0694% | 231/512 | 45.1% | 56/2187 | 2.56% |
| 7 | 11/151200 | 0.00728% | 0 | 0% | 0 | 0% | 0 | 0% |
| 8 | 1/107520 | 0.000930% | 1/40320 | 0.00248% | 495/2048 | 24.2% | 1/2187 | 0.0457% |
| 9 | 1/1088640 | 0.0000919% | 0 | 0% | 0 | 0% | 0 | 0% |
| 10 | 1/7257600 | 0.0000138% | 0 | 0% | 33/1024 | 3.22% | 0 | 0% |
| 11 | 0 | 0% | 0 | 0% | 0 | 0% | 0 | 0% |
| 12 | 1/479001600 | 0.000000209% | 0 | 0% | 1/2048 | 0.0488% | 0 | 0% |
